

Understanding a company’s financial health is paramount for investors, and the income statement serves as a foundational tool in this analysis. Also known as the profit and loss statement (P&L), it details how revenue is transformed into profit over a specific period. This guide delves into the essentials of income statement analysis, offering insights into key components and metrics that can aid in evaluating a company’s performance.
1. Retrieving Financial Statements
Begin by accessing the company’s financial statements. It’s advisable to select a company within your circle of competence, as familiarity with the industry enhances understanding. For instance, if analyzing Facebook (now Meta Platforms, Inc.), you can find their financial reports on their investor relations page or through platforms like EDGAR, the SEC’s official document repository.
2. Deciphering the Income Statement
The income statement provides a snapshot of a company’s revenues and expenses, culminating in the net income for the period. Key components include:
- Revenue (Top Line): This represents the total income generated from sales of goods or services. It’s termed the “top line” because it appears at the top of the statement.
- Cost of Goods Sold (COGS): Direct costs attributable to the production of goods sold by the company.
- Gross Profit: Calculated as Revenue minus COGS, it indicates the profit earned before accounting for operating expenses.
- Operating Expenses: These include costs such as marketing, research and development (R&D), and administrative expenses.
- Operating Income: Also known as EBIT (Earnings Before Interest and Taxes), it’s derived by subtracting operating expenses from gross profit.
- Net Income (Bottom Line): The final profit after all expenses, taxes, and interest have been deducted from total revenue.
3. Key Metrics and Their Significance
Analyzing specific metrics can provide deeper insights into a company’s operational efficiency and profitability:
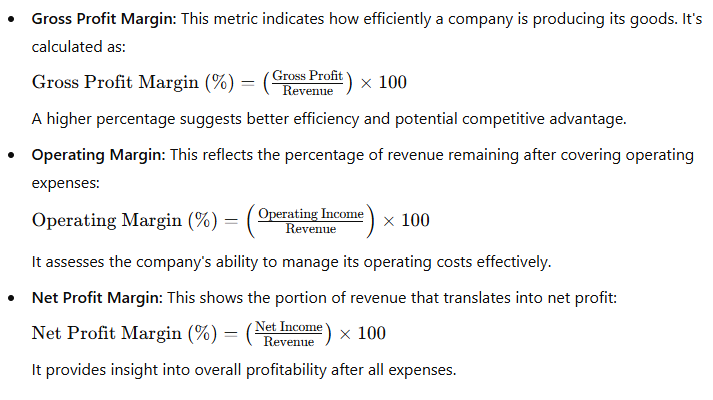
4. Assessing Competitive Advantage Through Margins
Gross margin, in particular, can shed light on a company’s competitive positioning. Companies with strong brands or unique products often enjoy higher gross margins due to pricing power. For example, Apple’s renowned brand allows it to command premium pricing, resulting in higher gross margins compared to competitors. In contrast, companies operating in highly competitive markets with undifferentiated products may experience lower margins.
5. The Role of Non-Cash Expenses
It’s essential to recognize non-cash expenses, such as depreciation and amortization, which appear on the income statement:
- Depreciation: Allocates the cost of tangible assets (e.g., machinery, buildings) over their useful lives.
- Amortization: Similar to depreciation but pertains to intangible assets (e.g., patents, trademarks).
While these don’t involve immediate cash outflows, they impact reported profits and provide insight into asset utilization.
6. Practical Application: Analyzing a Real Income Statement
To illustrate, consider examining a 10-year income statement of a company like Facebook. By reviewing trends in revenue growth, gross profit margins, and net income, you can assess the company’s growth trajectory and operational efficiency. Consistent improvement in these metrics over time often signals a robust and well-managed business.
7. Conclusion
Mastering income statement analysis is a crucial step for investors aiming to make informed decisions. By focusing on key components and metrics, and understanding their implications, you can gain a comprehensive view of a company’s financial performance and potential for sustained profitability.